


http://downdetector.com.br/
Mostrando postagens com marcador monitoramento. Mostrar todas as postagens
Mostrando postagens com marcador monitoramento. Mostrar todas as postagens
terça-feira, 3 de abril de 2018
Internet - divulga disponibilidade de sites - (avaliar, acho que precisa melhorar)

terça-feira, 21 de novembro de 2017
Zabbix - How To Install Zabbix Server 3.4.4 Into Ubuntu 17.04

Zabbix is an open source network monitoring tools. Now release Zabbix Server 3.4.4 for installation process on Ubuntu 17.04. I have install Zabbix Server 3.4.4 into ubuntu 17.04.
Step #01: Your server must update and upgrade
root@Zabbix-Server:~# apt-get update
Successfully completed update then run upgrade command.
root@Zabbix-Server:~# apt-get upgrade
Then reboot your machine command reboot with root user or using sudo.
Step #02: Now install apache web server
root@Zabbix-Server:~# apt-get install apache2
Step #03: When completed install apache server then install mysql database server.
root@Zabbix-Server:~# apt-get install mysql-server
Mysql server setup then type password two times.
Step #04: Zabbix update version install many php. Copy all code in one line then run it.
root@Zabbix-Server:~# apt-get install php php7.0-cli php7.0-common php7.0-mysql php7.0-mysql php7.0-curl php7.0-json php7.0-cgi php7.0 libapache2-mod-php
Start your apache server command line
root@Zabbix-Server:~# service apache2 start
Step #05: Download Zabbix update deb file using wget command.
root@Zabbix-Server:~# wget http://repo.zabbix.com/zabbix/3.4/ubuntu/pool/main/z/zabbix-release/zabbix-release_3.4-1+xenial_all.deb
Then follow below command for install deb file.
root@Zabbix-Server:~# dpkg -i zabbix-release_3.4-1+xenial_all.deb
Run update command
root@Zabbix-Server:~# apt-get update
Step #06: Install Zabbix mysql and Zabbix frontend-php
root@Zabbix-Server:~# apt-get install zabbix-server-mysql zabbix-frontend-php
Step #06: Create Zabbix mysq database. Goto mysql -u root -p
mysql> create database zabbix character set utf8 collate utf8_bin;
Query OK, 1 row affected (0.00 sec)
mysql> grant all privileges on zabbix.* to zabbix@localhost identified by 'passw0rd';
Query OK, 0 rows affected, 1 warning (0.00 sec)
mysql> flush privileges;
Query OK, 0 rows affected (0.00 sec)
mysql> cd database/mysql
     mysql -uzabbix -ppassw0rd zabbix < schema.sql
     mysql -uzabbix -ppassw0rd zabbix < images.sql
     mysql -uzabbix -ppassw0rd zabbix < data.sql
 \q
Step #07: Create Zabbix mysql table
root@Zabbix-Server:~# cd /usr/share/doc/zabbix-server-mysql/
Using below command for create zabbix database table
root@Zabbix-Server:~# zcat create.sql.gz | mysql -uroot zabbix -p
Step #08: Ensure Zabbix Server conf file inserted below lines such as
root@Zabbix-Server:~# vi /etc/zabbix/zabbix_server.conf
Insert all lines into server conf file.
DBHost=localhost
DBName=zabbix
DBUser=zabbix
DBPassword=passw0rd
Step #09: Edit your Server local time zone where Server located. When your server Newyork then type America/New_York into php.ini file. Line number 924
root@Zabbix-Server:~# vi /etc/php/7.0/apache2/php.ini
Example below.
date.timezone ="America/New_York"
Now apache and Zabbix server start all is ok. Going to your browser and type your Zabbix Server IP address and press Enter.
root@Zabbix-Server:~# service apache2 restart
If you see does’t start Zabbix Server so now start command below.
root@Zabbix-Server:~# service zabbix-server start
Now goto your browser type Zabbix server IP address as like below.
http://Zabbix-Server-IP/zabbix/
Then complete installation process now login here.
User Name : Admin
Password : zabbix
See video
fonte: http://technologyrss.com/install-zabbix-server-3-4-4-ubuntu-17-04/
segunda-feira, 13 de março de 2017
Monitoramento - iperf publico
.\iperf3.exe -c iperf.volia.net -u -b 940M -O2
Connecting to host iperf.volia.net, port 5201
[  4] local *.*.*.* port 64288 connected to 82.144.193.18 port 5201
[ ID] Interval           Transfer     Bandwidth       Total Datagrams
[  4]   0.00-1.00   sec   101 MBytes   846 Mbits/sec  12910  (omitted)
[  4]   1.00-1.00   sec   113 MBytes   473 Mbits/sec  28876
[  4]   1.00-2.00   sec   113 MBytes   946 Mbits/sec  14437
[  4]   2.00-3.00   sec   113 MBytes   946 Mbits/sec  14437
[  4]   3.00-4.00   sec   113 MBytes   946 Mbits/sec  14438
[  4]   4.00-5.00   sec   113 MBytes   946 Mbits/sec  14437
[  4]   5.00-6.00   sec   113 MBytes   946 Mbits/sec  14437
[  4]   6.00-7.00   sec   113 MBytes   946 Mbits/sec  14438
quinta-feira, 16 de fevereiro de 2017
Librenms - Movendo a instalação para outro servidor
How do I move my LibreNMS install to another server?
If you are moving from one CPU architecture to another then you will need to dump the rrd files and re-create them. If you are inthis scenario then you can use Dan Brown's migration scripts.
If you are just moving to another server with the same CPU architecture then the following steps should be all that's needed:
- Install LibreNMS as per our normal documentation, you don't need to run through the web installer or building the sql schema.
- Stop cron by commenting out all lines in `/etc/cron.d/librenms`
- Dump the MySQL database `librenms` and import this into your new server.
- Copy the `rrd/` folder to the new server.
- Copy the `config.php` file to the new server.
- Renable cron by uncommenting all lines in `/etc/cron.d/librenms`
quinta-feira, 9 de fevereiro de 2017
GenieACS - instalacao (tambem funciona para Ubuntu14.04)
For Sable Version
1- Get package dependencies. I like to use joe as editor for later file edition.aptitude install checkinstall build-essential zlib1g-dev libssl-dev libreadline6-dev libyaml-dev sudo unzip redis-server mongodb libsqlite3-dev curl joe tmux2- Get, Compile and Install Ruby 2.3.1
cd /opt3- Get, Compile and Install Node 0.12.17
wget https://cache.ruby-lang.org/pub/ruby/2.3/ruby-2.3.1.tar.gz
tar -zxvf ruby-2.3.1.tar.gz
cd ruby-2.3.1
./configure
make
make install
gem install rails
gem install bundle --pre
cd /opt4- Get GenieACS stable 1.0.7
wget https://nodejs.org/download/release/v0.12.17/node-v0.12.17.tar.gz
tar -xzvf node-v0.12.17.tar.gz
cd node-v0.12.17
./configure
make
make install
cd /opt5- Get GenieACS GUI stable v1.0
wget https://github.com/zaidka/genieacs/releases/download/v1.0.7/genieacs-1.0.7.tgz
tar -xzvf genieacs-1.0.7.tgz
mv package genieacs
cd genieacs
npm install
npm run configure
cd /optFrom this point you can follow other guides like startup/stop scripts and such.
wget https://github.com/zaidka/genieacs-gui/archive/v1.0.zip
unzip v1.0.zip
mv genieacs-gui-1.0 genieacs-gui
cd genieacs-gui
bundle update
cp config/graphs-sample.json.erb config/graphs.json.erb
cp config/index_parameters-sample.yml config/index_parameters.yml
cp config/summary_parameters-sample.yml config/summary_parameters.yml
cp config/parameters_edit-sample.yml config/parameters_edit.yml
cp config/parameter_renderers-sample.yml config/parameter_renderers.yml
cp config/roles-sample.yml config/roles.yml
cp config/users-sample.yml config/users.yml
For Alpha (1.1.0) Version
1- Get package dependencies. I like to use joe as editor for later file edition.aptitude install checkinstall build-essential zlib1g-dev libssl-dev libreadline6-dev libyaml-dev sudo unzip redis-server mongodb libsqlite3-dev curl joe tmux2- Get, Compile and Install Ruby 2.3.1
cd /opt3- Get, Compile and Install Node 4.6.2
wget https://cache.ruby-lang.org/pub/ruby/2.3/ruby-2.3.1.tar.gz
tar -zxvf ruby-2.3.1.tar.gz
cd ruby-2.3.1
./configure
make
make install
gem install rails
gem install bundle --pre
cd /opt4- Get GenieACS alpha 1.1.0
wget https://nodejs.org/download/release/v4.6.2/node-v4.6.2.tar.gz
tar -xzvf node-v4.6.2.tar.gz
cd node-v4.6.2
./configure
make
make install
cd /opt5- Get GenieACS GUI alpha v1.1.0
wget https://github.com/zaidka/genieacs/archive/master.zip
unzip master.zip
rm master.zip
cd genieacs-master
npm install
npm run configure
npm run compile
cd /optFrom this point you can follow other guides like startup/stop scripts and such.
wget https://github.com/zaidka/genieacs-gui/archive/master.zip
unzip master.zip
cd genieacs-gui-master
bundle install
bundle update
cp config/graphs-sample.json.erb config/graphs.json.erb
cp config/index_parameters-sample.yml config/index_parameters.yml
cp config/summary_parameters-sample.yml config/summary_parameters.yml
cp config/parameters_edit-sample.yml config/parameters_edit.yml
cp config/parameter_renderers-sample.yml config/parameter_renderers.yml
cp config/roles-sample.yml config/roles.yml
cp config/users-sample.yml config/users.yml
bin/rails db:migrate RAILS_ENV=development
fonte: https://github.com/zaidka/genieacs/wiki/Installation-in-Debian-8.6
-------- Comentários ----
- há uma carencia grande de documentação para configurar corretamente os CPEs.
- os scripts passa-a-passo para Ubuntu 14.04 ou qq outro que está no site não funcionam corretamente, acreditem testei todos, inclusive o scrip .sh que dá uma m...a!
- para mim o produto não é escalavel o suficiente e nem gera relatorios que eu preciso.
- falta eu incluir os adendos como fail2ban e log.io e concatenar as informações de criação de scripts de down e up que estao espalhado pelo site do projeto. (não sei se farei já que ele não me atendo para aquilo que eu preciso)
- tem um bug violento na aba de Devices cuja tabela vem em branco na versão 1.1.0, sei que na versao anterior estava funcionando....mas acho que perco alguma features da 1.1 que talvez me seja util.
quinta-feira, 24 de novembro de 2016
Redes - Net Monitoring For Employees & Schools (Monitor, Record and Report All Employee Activity)

Employee monitoring software has become an essential tool for tracking
your employee activity to increase productivity in offices.
If you are a business leader, a teacher, a chairman of a company or
project supervisor, you need strong tracking application to keep an eye
over the screen of your team members.
It happens many times that many team members spare their time in
watching unnecessary content on the Internet or using your resources for
their personal use or just spending time in web browsing.
If you want to monitor their activities, you need nothing more than
installing our software. You don't need to register - just download and
install.
Net Monitor for Employees Professional lets
you see the screens of all network computer monitors, making it easy to
detect an unauthorized and prohibited PC or Mac use.
With this tool, not only can you monitor screens, you can also take
control of any network PC or Mac by controlling the mouse and keyboard.
When you are not at your desk, you can record screens, visited web sites
and used applications for later review of your team member activity.
You can easily log which websites your employees are visiting or log
application use activity - see if employee is using the application and
for how long.
Advanced key logger reports allow you to see what your employee are typing in each application.
With the ability to block individual websites, you'll find Net Monitor
for Employees Professional invaluable for preventing unproductive web
browsing during work time.
Now you can know for sure whether the employee are working hard or they
are just wasting time. Record computer screens to get a proof.
fonte: http://www.itlearnweb.com/2016/10/net-monitoring-for-employees-schools.html
nota: nesta fonte tem um link "alternativo" para baixar o software (por sua conta e risco)
nota: nesta fonte tem um link "alternativo" para baixar o software (por sua conta e risco)
terça-feira, 18 de outubro de 2016
terça-feira, 5 de julho de 2016
NetSurveyor - avaliar pois é free
NetSurveyor — 802.11 Network Discovery / Wi-Fi Scanner

NetSurveyor is an 802.11 (Wi-Fi) network discovery tool that gathers information about nearby wireless access points in real time and displays it in useful ways. Similar in purpose to NetStumbler, it includes many more features. The data is displayed using a variety of different diagnostic views and charts. Data can be recorded for extended periods and played-back at a later date/time. Also, reports can be generated in Adobe PDF format. Applications for NetSurveyor include the following:
- During the installation of a wireless network, as an aid in verifying the network is properly configured and antennas are positioned at locations to achieve efficient transmission / reception — that is, for use in verifying Wi-Fi coverage and maximizing beacon signal strength
- Trouble-shooting an existing network or wireless environment that is performing poorly
- Reporting the presence of Wi-Fi networks and local access points and the signal strengths of their beacons
- Conducting wireless site surveys where the installer is interested in learning about the coverage of a new or existing access point, roaming capability, presence of RF interference or “dead spots”, and optimum location of access points, their antennas and client stations
- In a secure business environment, for use in detecting the presence of rogue access points
- As a learning tool to help understand the relationship between access points (BSSIDs), wireless networks (SSIDs), and client stations (STAs)

NetSurveyor is a diagnostic tool that falls under the category of Wi-Fi Scanners or 802.11 Network Discovery Tools. The best known in this category is NetStumbler. A discovery tool reports the Service Set Identifier (SSID) for each wireless network it detects, along with the channel used by the access point (AP) servicing that network. The way this works is that roughly every 100 mSec an AP sends an “I’m here” beacon – and the discovery tool (running on your laptop and using its 802.11 wireless adapter, also known as a station or STA) picks-up that beacon and adds the SSID to its list of known wireless networks. In addition, the discovery tool reports the RSSI (Received Signal Strength Indication) for each AP, which is roughly an indication of how close the AP is to your current location (i.e. how close it is to the client STA). Just to be clear, the RSSI reflects the strength of the beacon as received by the STA – it is not an indication of performance.
NetSurveyor distinguishes itself from other tools in its category in the following ways:
- It’s free.
- In addition to the grid that repeatedly updates information about each access point, there are 6 graphical, diagnostic views: (1) Timecourse of Beacon Qualities For Each Access Point, (2) Differential Display of Beacon Qualities for Each Access Point, (3) Usage of Each of the 802.11 b/g Channels, (4) Timecourse of the Usage of Each of the 802.11 b/g Channels, (5) Heatmap / Waterfall Chart of the 802.11 b/g Channels and (6) Channel Spectrogram of the 802.11 b/g Channels. The more (and different) ways you have at looking at data then the greater the chance something will catch your eye that you might otherwise miss if only a single type of chart were used.
- Generates reports in Adobe PDF format that include the list of access points and their properties along with images of each of the 6 diagnostic charts.
- Powerful and innovative logging and recording capability. Other products, if they even offer a recording/playback feature, usually follow the “tape recorder” paradigm. NetSurveyor's playback mode is unique in that it shows you all the recorded data – that is, you do not press a ‘play’ button and then forced to watch minutes or hours of data scroll by in the hope that some unusual event will catch your eye. NetSurveyor’s unique approach makes reviewing recorded data a snap.
- If your laptop or PC has multiple wireless adapters installed – not a problem. When NetSurveyor launches it detects each of these and asks you to choose which one to use for that session.
- Supports most all wireless adapters – that is, those that are installed with an NDIS 5.x driver (or later). This would include wireless adapters running on Windows XP, Vista and Windows 7.
- Can be run in ‘Demo’ mode – so, even if you don’t have a wireless adapter attached to your desktop or laptop machine you can still experiment with the application to see whether it suits your needs.

NetSurveyor is distributed as freeware and does not require a license. You are free to download it and use it on as many machines as you like.
quinta-feira, 19 de maio de 2016
RRD - removendo pontos fora da curva
Removing spikes from RRD databases
 RRDs
are fixed size databases for storing time series data. They collect
information given to them and normalize it to permit trending over long
periods of time.
RRDs
are fixed size databases for storing time series data. They collect
information given to them and normalize it to permit trending over long
periods of time.Spurious data may inadvertently make it’s way into a database. Treating this data is possible using the following means:
- Set the rrd-min and/or rrd-max variable(s) for each datasource when creating new RRD databases
- Use rrdtool dump to export the RRD database to XML format, edit out the spurious values and import the data back into the RRD database
- Use rrd tune to apply rrd-min and/or rrd-max variable(s) to an existing RRD database. All values outside the minimum or maximum defined bounds will be set to NaN.
rrdtool tune--maximum :
- Use the perl script removespikes.pl. This would remove all spikes within 1% of the datapoints in the rrd file. If 1% does not fix them, modify the % value up until all the spikes are removed. Though this may eat up some valid values in the process, use with caution!
perl removespikes.pl -l 1 fastrouter_ethernet0_1.rrd
- Use rrd_editor, a cross platform win32 or perl/tk tool to seek and remove spikes in an RRD. I have not used the tool, but according to comments it works as advertised. It also lets you easily add or remove RRAs and datasources from an RRD, which is a golden feature for many of us.
- Use killspike2 an RRD spike removal script distributed as part of the Cricket network management system. I have not used the script, but it is known to work.
genDevConfig will automatically set rrd-min and rrd-max values for all config-tree targets it creates for Cricket.
fonte: http://acktomic.com/2007/08/31/removing-spikes-from-rrd-databases/
(avaliar pois é muito antigo)
---- manual
rrdtool dump filename.rrd > filename.xml
vi filename.xml
rrdtool restore filename.xml filename.rrd
terça-feira, 17 de maio de 2016
IPERF - Testando performance

Testing Network Throughput with an Iperf Server
Note: Iperf3 is available with a few added features. However, I occasionally want to use jperf so that I can pass along graphs to the management team.
Building the Server
We are going to assume that you already have Ubuntu 14.04 up and running on a VM somewhere. If you need help doing that, check out this article from Frank Hinek.Launch a SSH session or open terminal and type:
sudo apt-get install iperfOnce installed, you can run:
sudo iperf -sThe -s switch starts iperf in server mode. However, I was interested in automating this a bit more. I wanted to be able to have iperf startup when the server did, with no interaction necessary. This allows for any of our engineers to use iperf without worrying if it has been started up. To do this, run the following commands:
sudo touch /etc/init.d/iperfsudo chmod +x /etc/init.d/iperfThese two commands create a script called iperf and make it executable. Next, we’ll load the script in nano:
sudo nano /etc/init.d/iperfand add the following lines:
!#/bin/bash/usr/bin/iperf -s &then save the file. You can add any switch you would like. Run iperf –help to see a full list of switches. Finally, we need to tell Ubuntu when we want iperf to run during the boot sequence:
sudo update-rc.d iperf defaultsOk, our server should be setup. To recap, we installed iperf from the default Ubuntu repos and automated its startup. The service should be running after a reboot, so lets move on to the client setup.
Client Setup – Mac OS X
Setting up a Mac with iperf2 is a simple task thanks to rudix. You can grab the package from this link and install it like any other application. Depending on how your security settings are configured, you may see the following message:
Go ahead and open the Security settings for your Mac and click ‘Open Anyway.’ Go through the standard install process and things should be ready to go in just a few minutes. Once installed, launch terminal and type:
iperf -c *serverIpAddress*
Where *serverIpAddress* is your iperf server. This will launch a single 10 second test, the results should be similar to this screenshot.
 Great!
So now we have setup our iperf server and verified that we can test.
From this point on, you should be able to connect to any LAN segment
that has access back to your iperf server and run a throughput test.
Please remember this is just a basic overview of what iperf is capable
of, and with a little tuning you can hit even better speeds. Have a look
at the manual for iperf here or by using the –help switch in terminal.
Great!
So now we have setup our iperf server and verified that we can test.
From this point on, you should be able to connect to any LAN segment
that has access back to your iperf server and run a throughput test.
Please remember this is just a basic overview of what iperf is capable
of, and with a little tuning you can hit even better speeds. Have a look
at the manual for iperf here or by using the –help switch in terminal.Note: Windows users can grab a client .exe from iperf.fr as well.
Wrap-Up
There you have it, a quick guide to setting up an Ubuntu 14.04 server with iperf2 and a Mac (or Windows) client setup guide. Overall this is quick and easy setup, and iperf is a great tool to have in your arsenal. It is a nice utility that helps troubleshoot LAN to datacenter connections and with an add-on like jperf you can even report you findings with a visual graph.In the next week or so I will have another post detailing some of the more advanced features of iperf. If you use iperf and have any good tips or tricks, leave a comment below!
fonte: https://vlan50.com/2015/04/07/testing-network-throughput-with-an-iperf-server/#more-75
segunda-feira, 25 de abril de 2016
Librenms - dump database
We've had a few reports of database problems with the latest
database schema update (055 -> 056). Symptoms are that lots of
pollers are running, but are unable to query the database due to the
schema update taking a very long time. This results in gaps in the
graphs due to the hanging pollers. On most systems, a simple
restart of mysql seems to resolve the issue:
vi /etc/cron.d/librenms # comment out all entries
ps -ef | grep librenms # wait until all librenms processes are stopped, or kill them
cd /opt/librenms # (or your install location, if not the standard)
mysqldump --add-drop-database librenms > librenms-backup.sql
mysql librenms < librenms-backup.sql
./discovery.php -h new # run the schema update
vi /etc/cron.d/librenms # uncomment all entries to start pollers again
---- ou
https://dev.mysql.com/doc/workbench/en/wb-admin-export-import-management.html
---- log all queries from mysql
http://dba.stackexchange.com/questions/62129/how-to-log-all-mysql-queries-into-log-file
--- liberar acesso remoto a mysql
https://rbgeek.wordpress.com/2014/09/23/enable-remote-access-of-mysql-on-ubuntu/
https://elias.praciano.com/2014/03/mysql-use-o-mysqlcheck-para-fazer-manutencao-das-suas-tabelas/
service mysql restart # or equivalent on your distroOn one system, a dump & reload of the LibreNMS database was necessary:
./discovery.php -h new # run the schema update
vi /etc/cron.d/librenms # comment out all entries
ps -ef | grep librenms # wait until all librenms processes are stopped, or kill them
cd /opt/librenms # (or your install location, if not the standard)
mysqldump --add-drop-database librenms > librenms-backup.sql
mysql librenms < librenms-backup.sql
./discovery.php -h new # run the schema update
vi /etc/cron.d/librenms # uncomment all entries to start pollers again
---- ou
https://dev.mysql.com/doc/workbench/en/wb-admin-export-import-management.html
---- log all queries from mysql
http://dba.stackexchange.com/questions/62129/how-to-log-all-mysql-queries-into-log-file
--- liberar acesso remoto a mysql
https://rbgeek.wordpress.com/2014/09/23/enable-remote-access-of-mysql-on-ubuntu/
https://elias.praciano.com/2014/03/mysql-use-o-mysqlcheck-para-fazer-manutencao-das-suas-tabelas/
LibreNMS - instalação
--- mesclar a informação de dois sites
http://docs.librenms.org/Installation/Installation-(Debian-Ubuntu)/
http://olivermarshall.net/how-to-install-librenms-on-ubuntu/
--- habilitar mib - para account users
http://docs.librenms.org/Extensions/MIB-based-polling/
--- meio desatualizado mas bem direto
http://www.magpiebd.net/2015/12/installing-librenms-graph-monitoring-in-redhatcentos-linux-7/
domingo, 20 de março de 2016
Observium: A Complete Network Management and Monitoring System for RHEL/CentOS
Observium is a PHP/MySQL driven Network
Observation and Monitoring application, that supports a wide range of
operating systems/hardware platforms including, Linux, Windows, FreeBSD,
Cisco, HP, Dell, NetApp and many more. It seeks to present a robust and
simple web interface to monitor health and performance of your network.

Observium gathers data from devices with the help of SNMP and display
those data in graphical pattern via a web interface. It makes hefty use
of the RRDtool package. It has a number of thin core design goals,
which includes collecting as much historical information about devices,
being totally auto-discovered with slight or no manual interruption, and
having a very simple yet powerful interface.
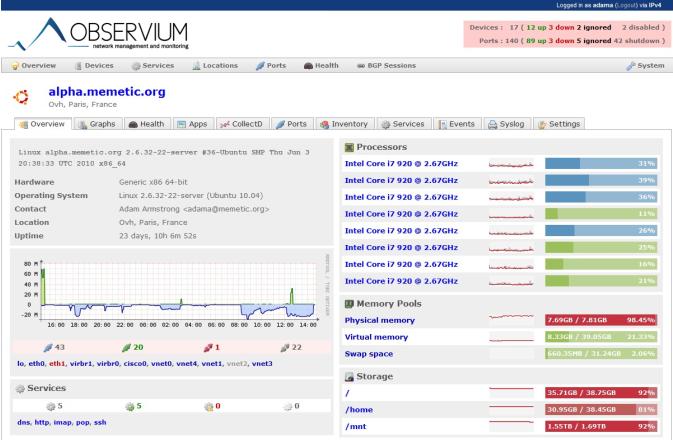
Install Observium in CentOS/RHEL
LibreNMS – alternative to Observium + others
Well without a doubt – a huge amount of things have changed in the last year with regards LibreNMS and all of them positive so I thought it was worth an update to go through some of those in more detail.
quarta-feira, 24 de fevereiro de 2016
PRTG - API
https://kb.paessler.com/en/topic/29983-how-to-export-a-list-of-devices-only
---- custom netflow channel definition
https://kb.paessler.com/en/topic/2143-can-i-add-custom-channels-to-standard-packet-sniffer-and-netflow-sensors
---- custom netflow channel definition
https://kb.paessler.com/en/topic/2143-can-i-add-custom-channels-to-standard-packet-sniffer-and-netflow-sensors
quinta-feira, 24 de dezembro de 2015
FAN Nagios - Instalação
Iremos ver o procedimento padrão para a instalação/configuração do FAN (Fully Automated Nagios) v2.0.
A utilização do recurso de servidores de Nagios em uma rede tem como objetivo de monitorar os status dos serviços e sistemas operacionais Microsoft Windows ou GNU/Linux, monitorar Roteadores, Switches e Links de Internet.
Baixa a versão do site oficial do FAN, a versão utilizada nesse procedimento e: FAN-2.0.iso utilize qualquer software para gravar a ISO.
quarta-feira, 23 de dezembro de 2015
Zabbix - instalação no Ubuntu 14.04
http://idroot.net/tutorials/how-to-install-zabbix-on-ubuntu-14-04/
https://thedutchlab.com/en/news/installing-zabbix-on-ubuntu-14-04
https://www.zabbix.com/documentation/2.4/manual/installation/install_from_packages#debian_ubuntu
há alguns erros ...revisar
--- suporte a snmp
http://blog.stack.systems/index.php/5-steps-to-zabbix-install/
--- suporte a smokeping
https://github.com/komeiy/Smokeping_Zabbix
https://thedutchlab.com/en/news/installing-zabbix-on-ubuntu-14-04
https://www.zabbix.com/documentation/2.4/manual/installation/install_from_packages#debian_ubuntu
há alguns erros ...revisar
--- suporte a snmp
http://blog.stack.systems/index.php/5-steps-to-zabbix-install/
--- suporte a smokeping
https://github.com/komeiy/Smokeping_Zabbix
Ferramentas de monitoramento - avaliar
http://blog.aeciopires.com/zabbix-zenoss-ou-pandora-quem-vai-ganhar-esta-briga
http://www.lbd.dcc.ufmg.br/colecoes/erad-rs/2013/009.pdf
http://blog.unicsolution.com/2013/11/best-monitoring-solution-omd-nagios.html
http://www.hardware.com.br/dicas/monitorando-servidores.html
http://www.lbd.dcc.ufmg.br/colecoes/erad-rs/2013/009.pdf
http://blog.unicsolution.com/2013/11/best-monitoring-solution-omd-nagios.html
http://www.hardware.com.br/dicas/monitorando-servidores.html
terça-feira, 8 de setembro de 2015
Cisco WLC SNMP Historical User Statistics Monitoring (w/ Syslog or Splunk)
Purpose:
This document aims to outline a way to extract client association data from a Cisco WLC so that it can be referenced later. My organization has a business requirement to track all wireless users. We use the techniques outlined in this document to take a "snap-shot" of our wireless clients associated with a Cisco WLC every 5 minutes and import that data into Splunk, where we can index and search through it any time we want.
This document will cover some basics needed to successfully extract connected client data from a Cisco WLC via SNMP. Although this feat has probably been done before, I was able to find little documentation on how to extract this specific data and use it for historical purposes. This document will provide MIB information to key OIDs of value, a bash scripting example, and lessons learned.
This document aims to outline a way to extract client association data from a Cisco WLC so that it can be referenced later. My organization has a business requirement to track all wireless users. We use the techniques outlined in this document to take a "snap-shot" of our wireless clients associated with a Cisco WLC every 5 minutes and import that data into Splunk, where we can index and search through it any time we want.
This document will cover some basics needed to successfully extract connected client data from a Cisco WLC via SNMP. Although this feat has probably been done before, I was able to find little documentation on how to extract this specific data and use it for historical purposes. This document will provide MIB information to key OIDs of value, a bash scripting example, and lessons learned.
quarta-feira, 19 de agosto de 2015
Como monitorar servidor DHCP - CentOS 7
Precisava monitorar os pools de um servidor DHCP rodando em CentOS7 via snmp.
Enfrentei vários problemas e depois de muita pesquisa, consegui reunir um passo-a-passo que me ajudou muito...
https://github.com/ohitz/dhcpd-snmp
Dai, vieram os problemas, típicos de quem trabalha com Linux
Enfrentei vários problemas e depois de muita pesquisa, consegui reunir um passo-a-passo que me ajudou muito...
1- Inicio,
Usei o seguinte link para baixar a aplicação escrita em perl:https://github.com/ohitz/dhcpd-snmp
Dai, vieram os problemas, típicos de quem trabalha com Linux


